Creates a custom ggplot2 theme for intervalpsych visualizations.
Examples
# Create sample interval data
df_intervals <- data.frame(
lower = c(0.1, 0.3, 0.2, 0.4),
upper = c(0.5, 0.7, 0.6, 0.8)
)
item_labels <- c("Item A", "Item B", "Item C", "Item D")
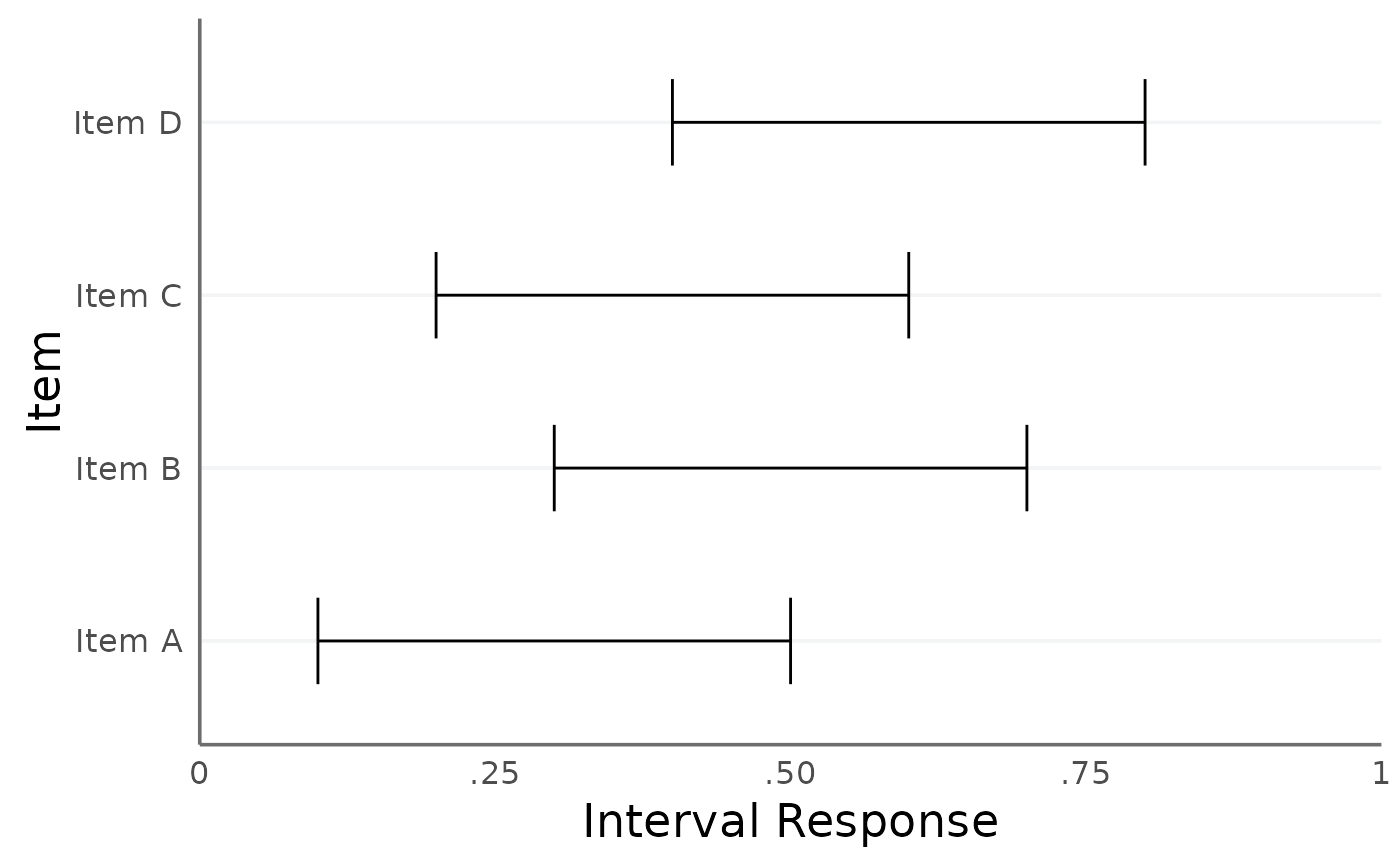
# Basic usage
plot_intervals(df_intervals, item_labels) +
theme_icm()
#> `height` was translated to `width`.
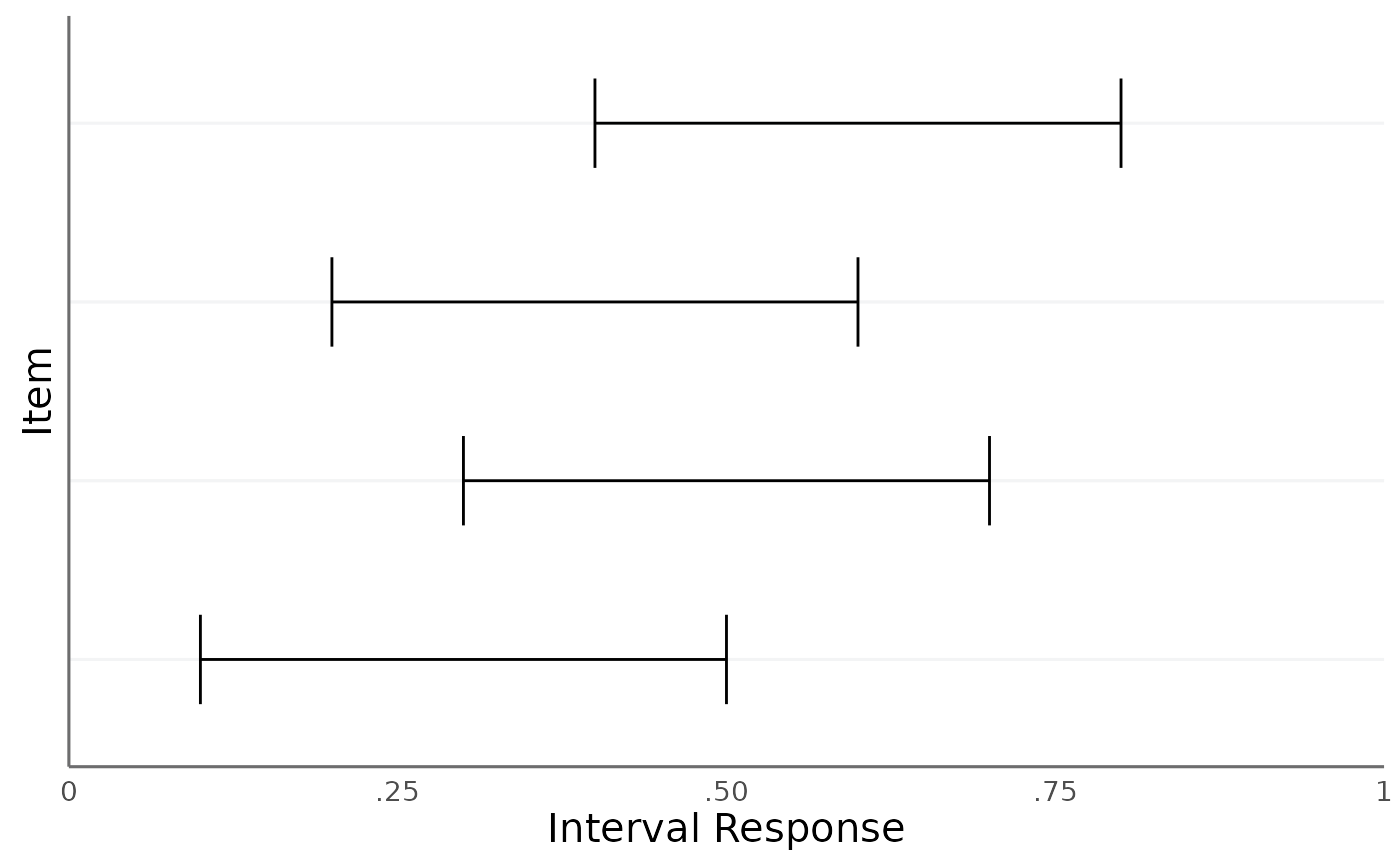
 # Hide y-axis text
plot_intervals(df_intervals, item_labels) +
theme_icm(hide_axis_text_y = TRUE)
#> `height` was translated to `width`.
# Hide y-axis text
plot_intervals(df_intervals, item_labels) +
theme_icm(hide_axis_text_y = TRUE)
#> `height` was translated to `width`.
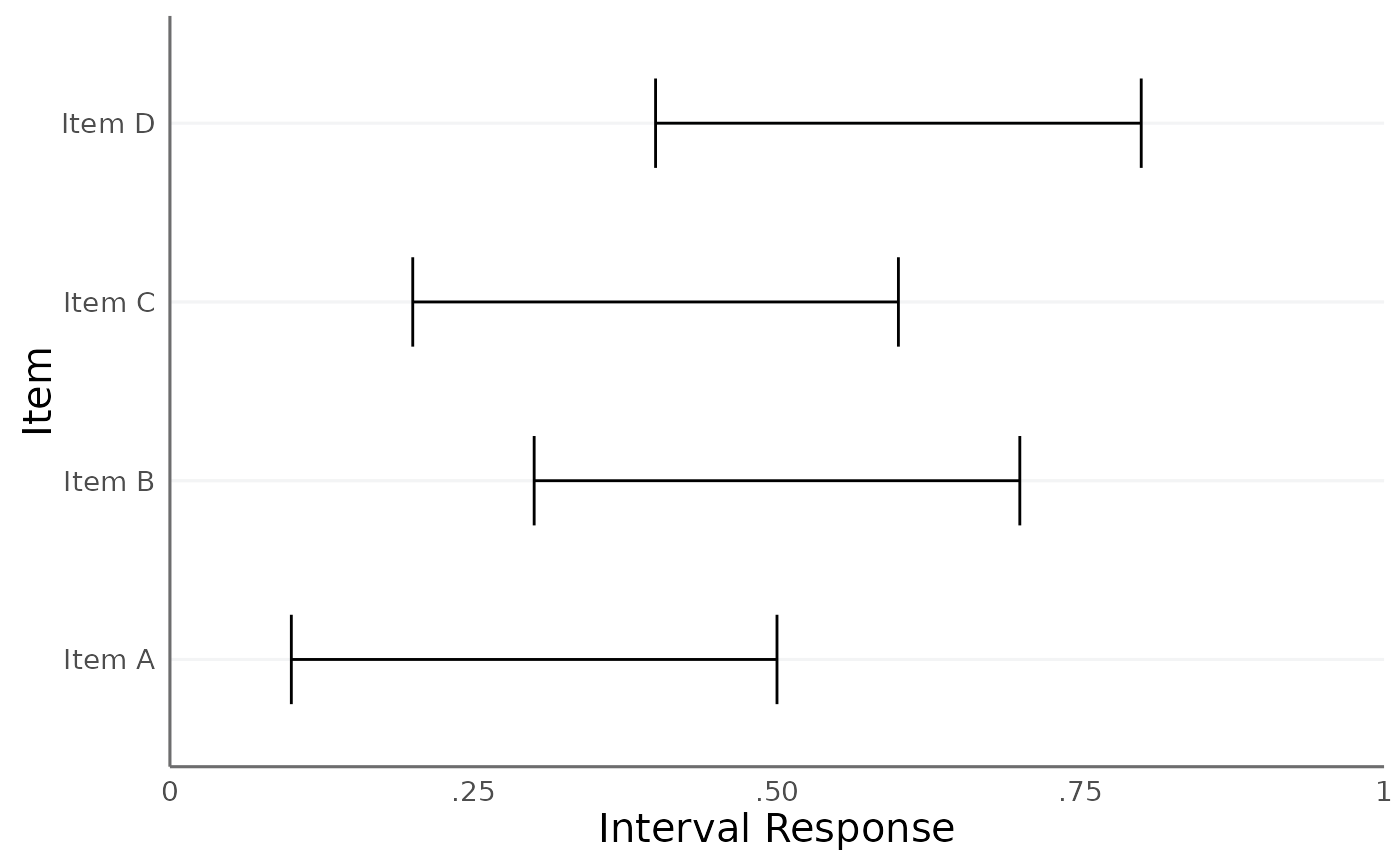
 # Custom base size
plot_intervals(df_intervals, item_labels) +
theme_icm(base_size = 14)
#> `height` was translated to `width`.
# Custom base size
plot_intervals(df_intervals, item_labels) +
theme_icm(base_size = 14)
#> `height` was translated to `width`.