Plot intervals from a data frame of interval bounds.
Usage
plot_intervals(df_interval_bounds, item_labels = NULL)
Arguments
- df_interval_bounds
A data frame with two columns: the lower and upper
bounds of the intervals.
- item_labels
An optional vector of labels for the items. Its length
must match the number of rows in df_interval_bounds.
Value
A ggplot object depicting the intervals.
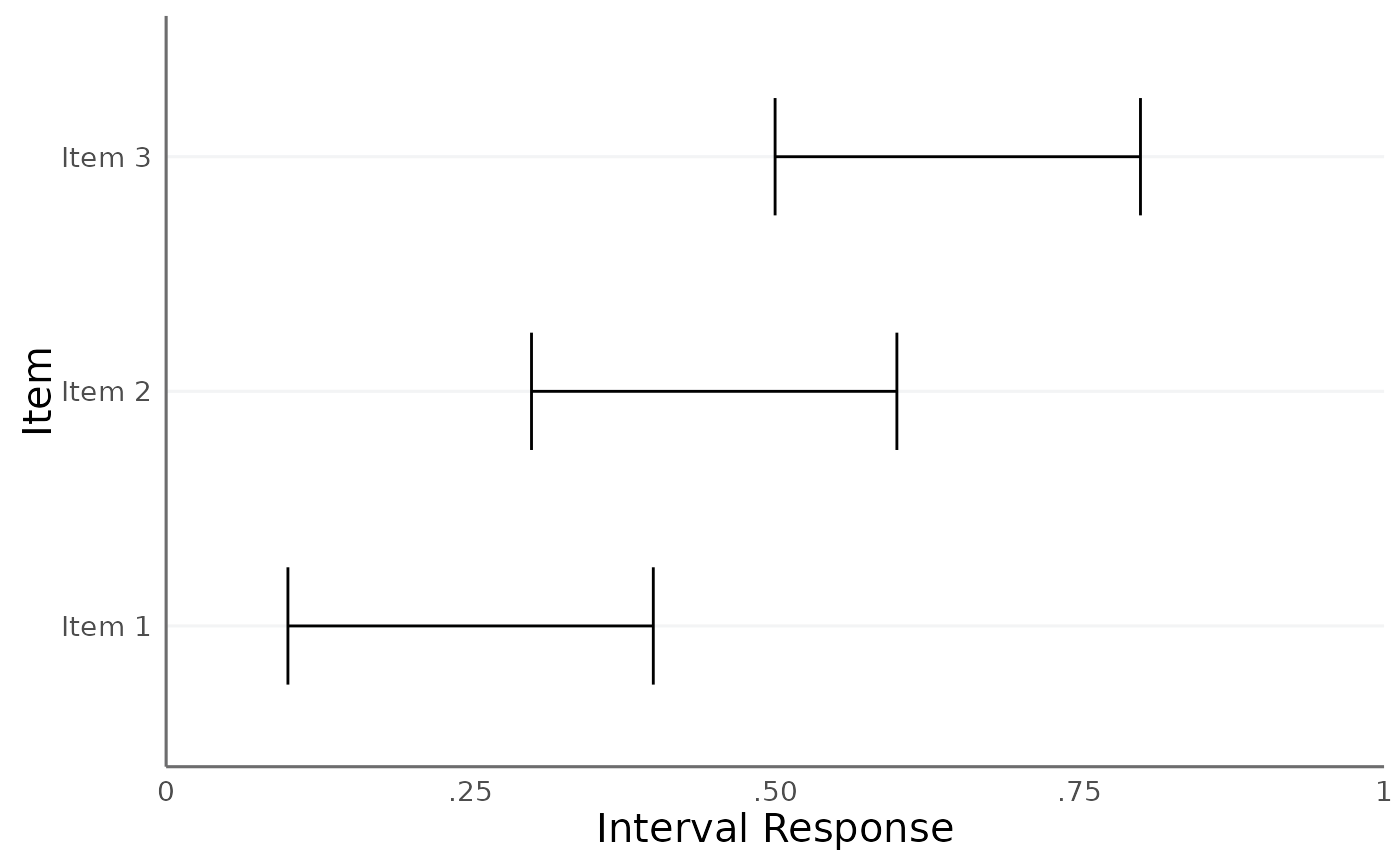
Examples
df <- data.frame(lower = c(0.1, 0.3, 0.5), upper = c(0.4, 0.6, 0.8))
labels <- c("Item 1", "Item 2", "Item 3")

plot_intervals(df, item_labels = labels)
#> `height` was translated to `width`.