This function provides a plot method for objects of class icm_stanfit.
Usage
# S3 method for class 'icm_stanfit'
plot(x, ...)Value
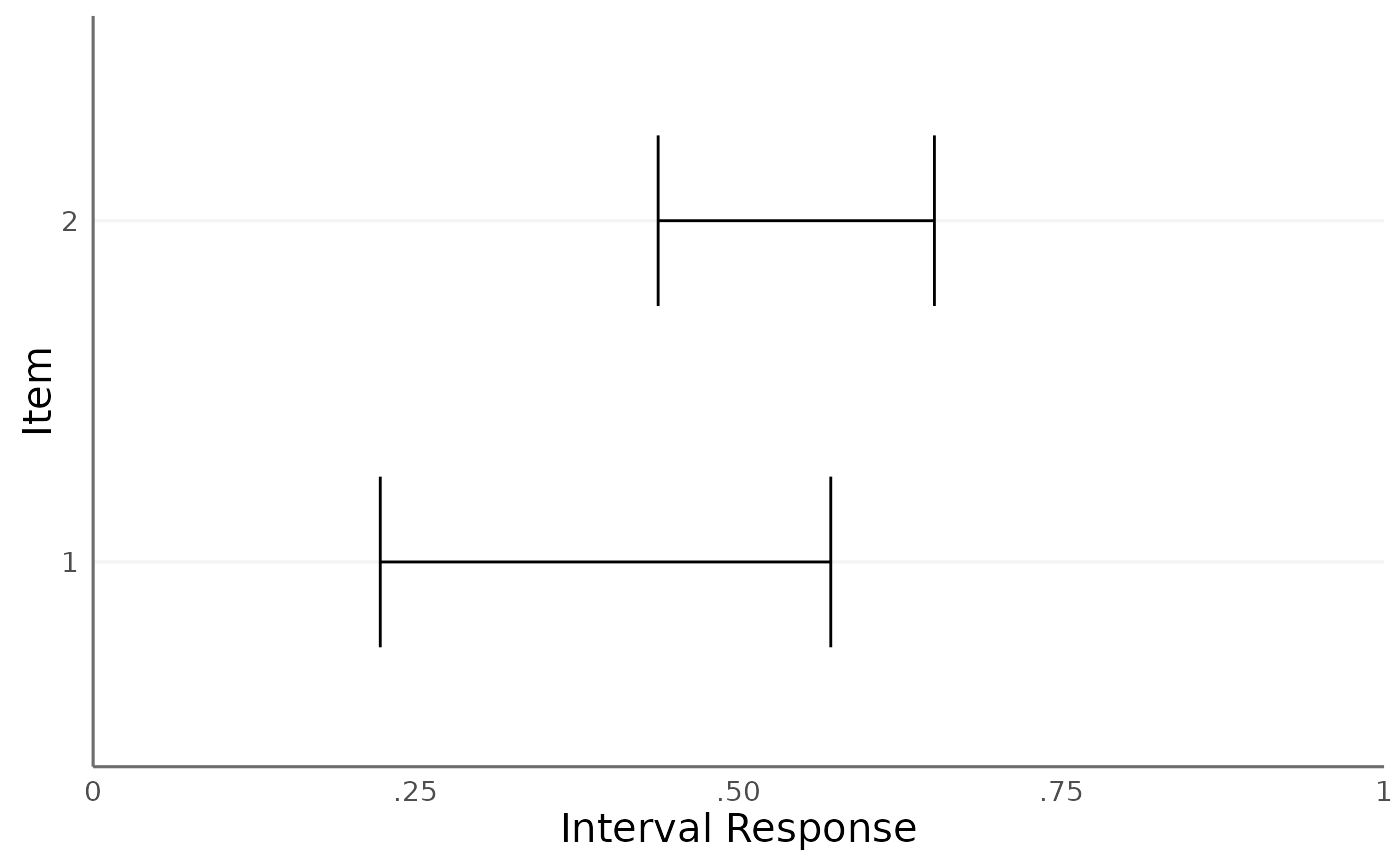
A plot generated by the plot_consensus() function.
Examples
# \donttest{
# Create minimal example data
df_simplex <- data.frame(
  x1 = c(0.3, 0.4, 0.2, 0.5),
  x2 = c(0.3, 0.2, 0.4, 0.2),
  x3 = c(0.4, 0.4, 0.4, 0.3)
)
id_person <- c(1, 1, 2, 2)
id_item <- c(1, 2, 1, 2)

# Fit ICM model
fit <- fit_icm(df_simplex, id_person, id_item, n_chains = 1,
               iter_sampling = 100, iter_warmup = 100,
               refresh = 0)
#> Warning: There were 6 divergent transitions after warmup. See
#> https://mc-stan.org/misc/warnings.html#divergent-transitions-after-warmup
#> to find out why this is a problem and how to eliminate them.
#> Warning: Examine the pairs() plot to diagnose sampling problems
#> Warning: The largest R-hat is 1.09, indicating chains have not mixed.
#> Running the chains for more iterations may help. See
#> https://mc-stan.org/misc/warnings.html#r-hat
#> Warning: Bulk Effective Samples Size (ESS) is too low, indicating posterior means and medians may be unreliable.
#> Running the chains for more iterations may help. See
#> https://mc-stan.org/misc/warnings.html#bulk-ess
#> Warning: Tail Effective Samples Size (ESS) is too low, indicating posterior variances and tail quantiles may be unreliable.
#> Running the chains for more iterations may help. See
#> https://mc-stan.org/misc/warnings.html#tail-ess

# Plot using S3 method
plot(fit)
#> `height` was translated to `width`.

# }
# }